Thursday, March 13, 2014

BI and MicroStrategy

Micro Strategy is the largest Independent Public BI Company. It is a business Intelligence, enterprise reporting and olap (Online Analytical Processing) software.

Micro strategy software allows reporting and analysis of data stored in a relational database, multi dimentional database or flat data file.
It has also supported mutli dimentional MOLAP processing and ROLAP.

MicroStrategy is specially Designed to help Companies easily change any of the Components of their BI Stack.

Following figure explains the same:


Products for different platforms:

1. MicroStrategy Analytics : It is an BI and predictive analytics software allowing user to search through and perform analytics on big data through divergent sources like data warehouses, Excel files, and Hadoop distributions.

2. MicroStrategy Mobile :  It allows customers to build and deploy mobile business apps for the iPhoneiPadAndroid, and BlackBerry

3. Usher : Usher is a mobile identity software application, which provides an always-on electronic alternative to traditional employee IDs, keys, and proximity cards

4. Alert : Alert is a mobile commerce application that offers retailers and other merchants the ability to create branded mobile apps for marketing, commerce, and loyalty

5. MicroStrategy Cloud : It is a cloud based platform which allows businesses to build and deploy their own strategic information applications without investing in infrastructure

Further, We would look into Micro strategy Architecture in next blog spot. Stay tuned!


References:
http://en.wikipedia.org/wiki/MicroStrategy
www.siliconindia.com
http://www.bryanbrandow.com/2012/03/getting-started-with-microstrategy.html

Friday, February 21, 2014

OBIEE:History, Architecture, Components with an Example

What is OBIEE?


OBIEE stands for Oracle Business Intelligence Enterprise Edition. It’s a platform for Oracle BI applications.


How OBIEE originated?

Hyperion Interactive Reporting (Brio) à OBIEE


Interactive Reporting was first developed by Brio Software and was known by various names like Brio Query, Explorer, Insight and finally Intelligence.

The earlier version of Hyperion Performance Suite was very basic. The Brio software added an intuitive user interface that supports query, reporting and alerting capabilities.


Following Figure explains how Brio Architectures was transformed to OBIEE.


What are the various functions of OBIEE?


1.      Dashboards

2.      BI Server

3.      OLAP Server

4.      Ad hoc query

5.      Alerting

6.      Pixel-Perfect reporting

7.      Office

8.      Balanced Scorecard

9.      Print Quality Financial Report


OBIEE components can be seen in following figure:


Each of the component seen above can be used to meet some specific requirement.


For Example:


Publisher: We will discuss this component in more detail as below:


Question: What if we need to send the daily report in the same format to senior management, updated with the latest data?


Answer: We can use BI Publisher to create report and use Delivers (one more Component seen in above figure) to send it by email.


This is a simple example of one of the features of OBIEE. We can do a lot more with each of the components.

We will learn more about OBIEE and its usage in next blog. Stay tuned!


References:

http://www.ealliancebusinessintelligence.com/oraclebusinessintelligenceprimer.php
http://siebelbipblog.blogspot.com/2012/08/what-is-oracle-bi-publisher-brief.html

Thursday, February 13, 2014

More about Dimensional Hierarchy

After learning basics of BI, ETL and concepts of facts and dimensions. We would now learn about “Dimension Hierarchies”

What is Dimension Hierarchies?
Dimension Hierarchy is the way all the attributes in a Dimension table are connected to each other by position.

By Analogy,
As Dimensions are key to navigating data warehouse/business Intelligence system,
Hierarchies are key to navigating dimensions

Types of Dimension Hierarchies:

1.   Fixed Depth Positional Hierarchies


  • Have fixed number of levels
  • Series of many to one relationship
  • Here each hierarchy level should appear as separate positional attributes in a dimension table
  • Set of Attributes should have meaningful name

Pros:
a.       Easiest to understand
b.      Predictable and fast query performance

Cons:
a.       Cannot be used when hierarchy is not a series of many to one relationship

2    Slightly Ragged / Variable Depth Hierarchies


Don’t have fixed number of level, but the range in depth is small

Pros:
a.    Consistent parent child relationship

Cons:
a.       Inconsistent at logical level

3     Ragged/Variable Depth Hierarchies


     This can be best explained by an example as above. Here we have atleast one member whos parent belongs to a hierarchy that is more than one level above the child.

This can be divided in 2 categories:

1. Ragged/Variable Depth Hierarchies with Hierarchy Bridge Tables

It has a specially constructed bridge table .This table contains a row for every possible path in the ragged hierarchy and enables all forms of hierarchy transversal to be accomplished with standard SQL rather than using special language extension which is not possible otherwise.

2. Ragged/Variable Depth Hierarchies with PathString Attributes

Bridge Table Creation can be avoided just by using a PathString attribute in the dimension. It contains a specially encoded text String which contains the complete path from the supreme node to the node described by the particular dimension row.

1 of the above 2 method for Variable Depth Hierarchies is selected based on Technical and organisational needs.

We will discuss some more interesting topic in next blog. Stay tuned.

References:
http://technet.microsoft.com/en-us/library/aa198068(v=sql.80).aspx
http://pic.dhe.ibm.com/infocenter/dataarch/v8r1/index.jsp?topic=%2Fcom.ibm.datatools.dimensional.ui.doc%2Ftopics%2Fc_dm_hierarchy_ragged.html
The Datawarehouse Tool Lit - Ralph Kimball, Margy Ross

Thursday, February 6, 2014

Brief Overview of ETL

In my previous blog post titled ‘Business Intelligence for Beginners’ we learnt basics of BI, Star Schema and defined few related terms.

In this post we will learn what ETL is in more detail. ETL stands for Extract, Transform, Load and is a process of extracting data from various sources, transforming them in a common format and loading the data in Data Warehouse. This data is then used for decision making.


In General, ETL process takes 70% of the DW development time.


Extraction:
Extraction is a process of getting data from various sources and transferring to Data warehouse. It’s not as simple as copy paste, its complex. There are various factors to it, which we will discuss further.

This is the most complex and time consuming part in the entire data warehousing process because of following reasons:

1.    The source system may be poorly designed.
2.    Deciding which data needs to be extracted from every source.
3.    Data needs to be extracted from heterogeneous and disparate system.
4.    Sources may have different Operating systems, DBMS, hardware and communication protocol.

Some Examples of Sources are ERP, CRM, Flat files, Batch File, text files, spreadsheets.
Also, this is not a onetime activity. As the source data gets updated Data warehouse also needs to be periodically (hourly, monthly or yearly) updated for getting up to date Information from raw data.

There are two extraction methods namely, Logical Extraction Method and Physical Extraction Method. We first need to decide how the data can be extracted logically before extracting it physically.

Transformation:
Transformation can be defined as applying set of rules/programs/functions to the data extracted from various sources.

This step is responsible for Data Validation, Accuracy, and Conversion of source data type according to the business rule of the organization.

Also, once the data is transformed data cleansing is done before loading data to target database.
Few forms of transformation:
1.    Simple one-to-one scalar transformation
-       0/1 for M/F of data
2.    One to many element transformation
-       4*20 address field for Street Address/City/Zip/Country
3.    Many to many element transformation
-       Detailed information of every individual

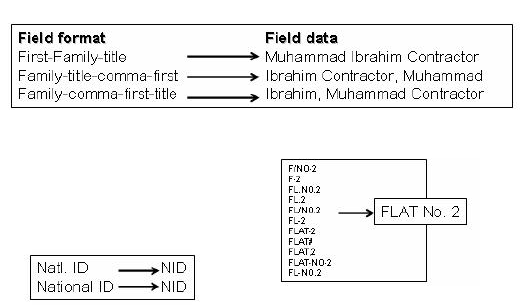
Example: First column in all 3 examples shown below shows the data extracted and the later shows how the data resembles after Transformation.


Loading:
Loading is a process of loading the transformed data to data warehouse in a particular format depending on organisational need. We need to load both facts and dimensions.

Using Following 3 strategies data can be uploaded:
1.    Full data refresh
2.    Incremental data refresh
3.    Continuous data refresh with constant data collection and loading using row level insert.

We will go in more depth in next blog-posts. Stay tuned!


References:


Monday, January 27, 2014

Business Intelligence for Beginners

I never thought I would write a blog anytime. But Thanks to MIS 587 Business Intelligence course at Eller College of Management at University of Arizona, I am now writing my first blog ever.

Why I selected MIS 587 Business Intelligence (BI) elective for Spring 2014?
Last few years, I have been hearing a lot of boom over Business Intelligence. Had a brief idea that it’s making meaningful information with raw data in hand that a Company/Business already has. Also, I had heard that it has a process called ETL (Extract - Transform - Load) to do this transformation. There may be many more things to it, not sure yet.

Following diagram explains my this understanding:

The curiosity over how this happens, what it exactly means and how this would benefit any Business, made me select BI as an elective for current semester. Also, was aware that BI knowledge on my resume would surely open more career opportunities for me.

Initial few Learnings about BI:
The contents in this blog would be concentrating more on the Data Warehousing concepts of BI.
Let us first understand what Dimensional Modelling is:
Dimensional Modelling is a technique used in Data warehouse which makes data model easy to understand from end user point of view.

Few terms to know:
Dataware house: Central repository of database used for Analytical or Reporting Purpose.
Datamarts: It is a subset of Dataware house confined to specific Functional Area.
Normalised structures: Good for Operational processing but complicated for BI queries.

Schemas for Dimensional Modelling:
There are two main types of schemas used in Dimensional Modelling:
1. Star Schema
2. OLAP cubes.

Star Schema: 
Before we get to know what a Star schema is, it would be better to learn a few terms:
Facts: Used for measurement. Mostly Numeric and Addictive.
Dimensions: They are used to qualify facts.
Grain: Single row of data.

In Star Schema, a single fact table is surrounded by many dimension tables. The resultant structure looks like a Star and hence it is called as Star Schema. Pictorially it can be shown as follows:


Also, once you have star schema you can implement it as cube.The flow for same is shown in figure below:

Learning dimensional modelling techniques for Star Schema are thus even more important.

Stay tuned for my next blog post to know how we would use these basic concepts learnt during different steps for Data Modelling techniques.

References:
http://proquest.safaribooksonline.com.ezproxy2.library.arizona.edu/book/databases/data-warehouses/9781118530801/firstchapter
http://bennyaustin.wordpress.com/2010/05/02/kimball-and-inmon-dw-models/